Shihong Li1 ![]() ,
Xiaofei Zhang2
,
Xiaofei Zhang2
For correspondence:- Shihong Li Email: lsh0567@163.com
Received: 25 June 2015 Accepted: 5 May 2016 Published: 28 June 2016
Citation: Li S, Zhang X. Structural determination and gynecological tumor diagnosis using antibody chip captured proteins. Trop J Pharm Res 2016; 15(6):1307-1312 doi: 10.4314/tjpr.v15i6.25
© 2016 The authors.
This is an Open Access article that uses a funding model which does not charge readers or their institutions for access and distributed under the terms of the Creative Commons Attribution License (http://creativecommons.org/licenses/by/4.0) and the Budapest Open Access Initiative (http://www.budapestopenaccessinitiative.org/read), which permit unrestricted use, distribution, and reproduction in any medium, provided the original work is properly credited..
Purpose: To identify markers for gynecological tumor diagnosis using antibody chip capture.
Methods: Marker proteins, including cancer antigen 153 (CA153), CA125, and carcinoembryonic antigen (CEA), were analyzed using antibody chip capture of serum samples. Fifteen agglutinin types that specifically recognized five common glycans (fucose, sialic acid, mannose, N - acetylgalactosamine, and N-acetylglucosamine) were used to detect marker protein glycan levels. The levels of CA153, CA125, and CEA from 49 healthy control samples, 31 breast cancer samples, 24 cervical cancer samples, and 19 ovarian cancer samples were used to measure the glycan levels of these marker proteins.
Results: In breast cancer samples, CA153 and CA125 were down-regulated (p < 0.01), while differences in ovarian cancer samples were not statistically significant (p > 0.01). The total accuracy was 85.1 %, with 96.8 % accuracy for breast cancer, 75 % in cervical cancer, and 78.9 % in ovarian cancer. Cross-validation analyses showed that breast cancer had 93.5 % accuracy, cervical cancer was 66.7 %, and ovarian cancer was 68.4 %, leading to 78.4 % total accuracy (58/74).
Conclusions: The results indicate that better clinical diagnosis of gynecological tumors can be obtained by monitoring changes in glycan levels of serum proteins and types of proteoglycan changes.
Introduction
It has been reported that glycans produced from glycosylation reactions function in many key biological processes because of their different covalent bonding patterns and branched structures. Studies have shown that changes in protein glycosylation at the cell surface during tumorigenesis are closely related to the occurrence and development of some cancers, including pancreatic cancer, mammary cancer, prostatic cancer, colon cancer, and gastric cancer [1]. These studies focused on the quantitative differences of protein expression and modification to provide more valuable information for accurate disease diagnoses [2].
Current studies of protein glycosylation changes have identified biological markers using various methods, such as enzymolysis, chromatographic separation, and mass spectrometry [3]. Microarray technology is a more specific approach for analyzing glycosylation modifications of proteins. The method includes the lectin microarray assay that uses lectins deposited on surfaces of chip carriers to classify protein glycosylation structures. It is convenient and applicable, using antibodies to capture specific proteins and test for specific glycosylation modifications with important potential applications in clinical diagnoses [4]. The current study explored the validity of measuring the structures of antibody chip captured proteins for clinical diagnoses of gynecological tumors using breast cancer, cervical cancer, and ovarian cancer tissue samples.
Methods
Reagents and instruments
To produce lectin microarrays, lectins were purchased from Vector Laboratories (Burlingame, CA, USA) and included: aleuria aurantia (AAL), lens culinaris agglutinin (LCA), maackia amurensis lectin (MAL) II, sambucus nigra agglutinin (SNA), concanavalin A (ConA), wheat germ agglutinin (WGA), dolichos biflorus agglutinin (DBA), soybean agglutinin (SBA), peanut agglutinin (PNA), vicia villosa lectin (VVL), datura stramonium lectin (DSL), sophora japonica agglutinin (SJA), ulex europaeus agglutinin (UEA) I, griffonia simplicifolia lectin (GSL) II, and lycopersicon esculentum lectin (LEL). Biotin amido - hexanoic acid N - hydroxysuccinimideester, streptavidin - labeled Cy3, and HEPES were purchased from Sigma-Aldrich (St. Louis, MO, USA).Other reagents were as follows: Bio-Spin6™ (miniature centrifugal separation column; Bio-Rad, Hercules, CA, USA); aldehyde substrate (Shanghai Light Array Biotech Co., Ltd, Shanghai, China); chip sampling instrument with a Smart Array48 GeeDom, and a fluorescence chip scanner with a LuxScan10K-A GeeDom (Capital Bio International, San Diego, CA, USA); and NaIO4 and sodium acetate (analytical reagents made in Zhanyun Chemical Co., Ltd, Shanghai, China).
The experiments were performed according to international guidelines and standards and were approved by the ethics committee of Linyi People’s Hospital, Shandong Province, (approval ref no. 1173). All studies adhered to the tenets of the Declaration of Helsinki, and all patients signed informed consents. All experiments followed international guidelines for biomedical research and experimentation involving human subjects [5].
Chip extraction of data
GenePix® Pro3.0 (software for biochip image analyses; Axon/Molecular Devices, Sunnyvale, CA, USA) was used to extract data for mid-values of fluorescent intensities in chip arrays, excluding background signal values. The Q test was used for data selection and to determine fluorescence intensities produced by an antibody, and the results were expressed as the mean of the remaining value.
Specimen collection
A total of 123 serum specimens confirmed as first visit cases without any treatment were provided by Linyi People’s Hospital (Shandong Province), including 31 cases with mammary cancer, 24 cases with cervical carcinomas, and 19 cases with ovarian cancer. Ages of the patients were 30 – 65 years (mean age 47 ± 5 years), 30 – 73 years (mean age 51 ± 5 years), and 28 – 73 years (mean age 50 ± 5 years),respectively, for the above-listed three cancer types. As controls, 49 healthy females were selected at the hospital with ages ranging from 31 – 69 years (mean age 50 years).
All blood specimens were collected according to the standard clinical procedures, after which serum samples were centrifuged and maintained at - 80 °C.
Serum specimen labeling
Ten µL serum specimens were diluted to 100 μL with 10 mM phosphate - buffered saline (PBS) and 1 μL of 20 mg/mL anhydrous N - dimethylformamide, the biotin labeling reagent, was added. After 1 hour, the mixture was mixed every 15 min. Then, the labeled reactant was added to a Bio-Spin6™ column and centrifuged for 4 min at 1000 ×g, after which biotin labeling reagent was removed, to collect the serum markers for future analyses.
Preparation and analysis of lectin microarrays
The microarray chip was divided into 10 subarray areas by using films. For each area, the sampling instrument applied the lectin six times at 1 g/L concentration. As a positive control, 0.05 g/L biotin-BSA was used. The lectin microarrays were kept in wet boxes and fixed at 4 °C overnight, while the incubations and washings were done at room temperature. The fixed lectin microarrays were incubated with surge-free sealants for 2 hours, then in 0.1 % PBST (PBS containing 0.1 % Tween 20), twice (each for 3 min), washed with distilled water for three times (each for 2 min),and the individual serum samples were added into the chip subarrays and incubated overnight at 4 °C. The process was repeated, and then streptavidin-labeled Cy3, diluted to 1:800, was added to each subarray and incubated for 1 h in the dark at room temperature. Finally, the microarray chips were dried, and a fluorescence chip scanner was used to scan the chips at 95 % laser intensity with a 750 photoelectric multiplier.
Data analysis
The data from lectin microarrays were logarithmically transformed and SPSS version 17.0 software (statistical analysis software; SPSS, Chicago, IL, USA) used the Mann-Whitney U test (nonparametric analyses) of two independent specimen groups, where purpose was to assess population distributions in both groups. Step discriminant analysis was used to establish discriminant function equations for specimen grouping, and differences were considered as statistically significant at p < 0.01.
Results
Lectin microarrays
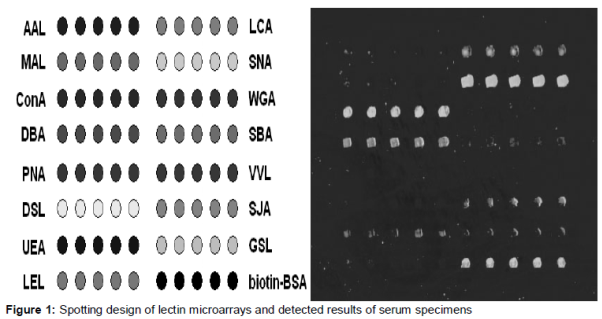
Microarray technology uses smaller samples and reagents with high sensitivity, and provides a parallel analysis with rapid results, which is ideal for analyses of multiple specimens. Because thousands of proteins are expressed in biological specimens and only a single specimen is clinically measured, the method should reflect the expression profile changes of proteins in a more accurate and comprehensive way [5,6]. Lectin microarray combines chip technology and the specific recognition of glycoprotein structures by lectin antibody recognition, thus allowing measurement of changes in glycan moieties added to proteins during disease. A recent study [7] described lectin microarray specificity in recognizing nascent glycan chains by use of standard glycoprotein markers including RNase B and fetuin. The results demonstrated the possibility of using lectin microarrays to determine glycosylation changes of proteins at the cell surface [8]. The study did not detect and test the specificity of specific lectin microarrays. In our study, a total of 15 different lectins could specifically distinguish common glycan chains, including fucose, sialic acid, mannose, N - acetyl - D - galactosamine (Gal NAc), and N - acetyl glucosamine (GlcNAc).
This study analyzed serum samples directly by biotin labeling, therefore, the stability of the labeling method, the repeatability of the results, and the accuracy could be determined. Previous microarray chip studies provided the methods and experimental conditions for labeling serum specimens by biotin labeling reagents, which ensured the repeatability of the results [9]. The spotting design of the lectin microarrays and detected results of serum specimens are shown in .
Lectin microarrays
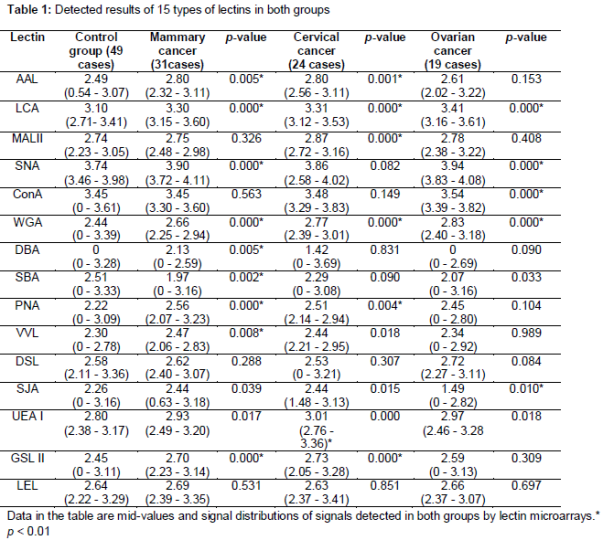
Lectin microarrays were analyzed by the Mann-Whitney U nonparametric test for lectin response signal distributions in both groups and the results are shown in .
The data suggest that compared to the control group, mammary cancer cases had increased signals for LCA, SNA, AAL, DBA, PNA, VVL, WGA, and GSL II, decreased signals for SBA, and unremarkable changes for DSL, LEL, MAL II, ConA, SJA, and UEA I. For cervical cancer cases, signals for LCA, MAL II, AAL, UEA I, PNA, WGA, and GSL II increased, while DSL, LEL, SNA, DBA, VVL, SBA, ConA, and SJA decreased. For ovarian cancer, ConA, LCA, SNA, and WGA increased, SJA was decreased, and AAL, DBA, PNA, VVL, GSL II, DSL, LEL, SBA, UEA I, and MAL II did not change.
Establishment of discriminant function equations for disease diagnosis
A total of 123 clinical serum specimens were divided into the control group and the tumor disease group (74 cases, including 31 with mammary cancer, 24 with cervical cancer, and 19 with ovarian cancer). Stepwise discriminant analyses were confirmed with the substitution of 15 different lectins as follows: AAL (X1), LCA (X2), MAL II (X3), SNA (X4), ConA (X5), WGA (X6), DBA (X7), SBA (X8), PNA (X9), VVL (X10), DSL (X11), SJA (X12), UEA I (X13), GSL II (X14), and LEL (X15). After analyses using SPSS 17.0 software, LCA (X2), WGA (X6), SBA (X8), and DSL (X11) matched the discriminant function equation, which suggested the significant impact of these indices on serum specimen grouping. The class one discriminant functions describing the control and disease groups are presented as Eqs 1 and 2.
In a retrospective test, specimens showed 85.7 % diagnosis accuracy in the control group and 83.8 % in the disease group, with 84.6 % total accuracy (104 / 123). In a cross-validation test, total accuracy was 84.6 % (104 / 123) with 85.7 % accuracy in the control and 83.8 % accuracy in the disease group. The results suggested a stable discriminant function equation which accurately classified the control and disease groups.
Establishment of discriminant function equations for tumor discrimination in the tumor disease groups
Specimens regarded as tumors by discriminant function equations in class one could be further divided into mammary cancer, cervical cancer, and ovarian cancer by class two equations. In this study, 31 cases were mammary cancer, 24 were cervical cancers, and 19 were ovarian cancers. Based on previous studies, 15 classes of lectins were substituted into the class two equations as variables of stepwise discriminant analyses, resulting in six matched indices: SNA (X4), WGA (X6), DBA (X7), DSL (X11), SJA (X12), and UEA I (X13). This proved significant in grouping clinical serum specimens. The class two equations are presented below (Eqs 3 and 4).
Ymammary cancer = -292.193 + 33.920X4 + 83.073X6 + 0.776X7 + 5.919X11 – 16.541X12 + 86.309X13 ………………….. (3)
Ycervical cancer = -300.753 + 28.552X4 + 92.157X6 – 0.618X7 + 2.140X11 – 16.891X12 + 91.807X13 ……………........ (4)
Yoophoroma = -332.843 + 32.438X4 + 95.472X6 – 0.489X7 + 4.824X11 – 20.513X12 + 94.328X13
The Y values for mammary cancer, cervical cancer, and ovarian cancer were calculated when the above equations included the substitutions of SNA (X4), WGA (X6), DBA (X7), DSL (X11), SJA (X12), and UEA I (X13). The maximum value of each tumor type provided the corresponding final diagnosis. shows the results of retrospective tests and cross validations of 74 cases.
Discussion
Studies show that changes of serum protein glycosylation found in different diseases may provide a basis for clinical diagnosis [10]. To date, CEA, CA125, and CA153 are the major serum markers used for diagnosing common gynecological malignant tumors (breast cancer, cervical cancer, and ovarian cancer) in the clinic, but the practical clinical detection demonstrates that the positive detection rate and specificity of tumor markers are not ideal and have limited value in some tumor diagnoses. The identification of new tumor biomarkers is an important goal of current tumor research. To improve the accuracy of tumor diagnosis, multiple and novel tumor biomarkers, combined with better detection methods, are needed.
However, current methods only provide positive detection rates using various indices, and the diagnostic specificity remains low, although the sensitivity is high. Therefore, the total diagnostic accuracy has not improved. This also demonstrates that the complexity of the tumor and its developmental processes cannot be defined by only one model, and tumor and non-tumor tissues cannot be distinguished clearly depending on the use of single biomarkers.
Serum protein glycosylations found in different diseases may provide novel targets for clinical diagnoses. Many biomarkers, such as CEA, CA125, and CA153 are glycosylated proteins used to clinically diagnose gynecologically malignant tumors. However, the expression levels of these marker proteins are only detectable at the protein level in clinical tests, and carbohydrate chain structural studies are not usually possible due to limited sample quantity.
This study used lectin microarrays with 15 selected classes of lectins to study five common chain structures, including fucose, sialic acid, mannose, Gal NAc, and GlcNAc. After the analyses of serum specimens, fingerprints of specimen glycan chain information were obtained, and were analyzed by stepwise discriminations, to screen lectin indices for the optimal specimen grouping and to describe relevant discriminant function equations.
Limitations of the study
The lectin chip technology does not provide carbohydrate chain structural information because it is only a quantitative assay. However, the quantitative data on carbohydrate chain structural changes in control and tumor samples could provide information to allow identification of glycoproteins to be used as new tumor biomarkers. Although the most common carbohydrate chain structural types can be included in the microarray chips, the assay is unable to provide all carbohydrate chain structural information of samples without expanding the lectins variety and number. This could be one reason for the low accuracy of this method in diagnosing cervical cancer and ovarian cancer samples. In the future, a larger sampling is needed to further validate this methodology to assess its possible clinical use in the early diagnosis of malignant gynecological tumors.
Conclusion
This study analyzed serum samples of healthy subjects and patients with breast cancer, cervical cancer, and ovarian cancer, based on a proteoglycan structural analyses system using microarray chip technology. Protein biomarkers and their glycan structural types were assessed for their clinical diagnostic value. A method of tumor diagnosis using protein expression levels and glycan structural information was established. The method can improve the clinical diagnostic accuracy of malignant gynecological tumors and may be useful in treatment design for cancers.
Declarations
Acknowledgement
References
Archives


News Updates